Affinity Diagrams
Click Here to download a guide to Affinity Diagrmas
5S 

80/20 Rule
Click Here to Download 80/20 Rule Guide
Box Plot
Click here to Dowload a Guide to Box Plots
COPIS / SIPOC
Click Here to Dowload Guide to SIPOC
Cause and Effect Diagram (Ishikawa)
Control Charts
Click here to dowload a guide to Control Charts
Critical to Quality Trees
Click here to view link
Critical to Quality (CTQ)
Types of Data
Test Your Knowledge on Types of Data
Click Here to Download a Guide To Types of Data
Data Collection Plan

Click Here to Download Guide to Data Collection Plan
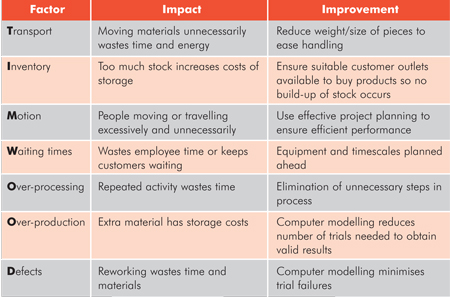
TIMWOOD


Mood’s Median Test / Alternative Hypothesis (Ha)
Six Sigma Capability
Histogram
Variance
Individual and Moving Range Charts
Kaizen
Normal Data
Null Hypothesis
Project Charter
Quality Function Deployment (QFD)
Regression Analysis
Taguchi Loss Function
Stakeholder Analysis
Standard Deviation
Statistical Process Control (SPC)
TAKT Time
Voice of the Customer (VOC)
X-Bar / R Chart / S Chart
P Chart, P Value
U Chart
NP Chart
